Summary
|
Healthcare produces some of the most relationship-rich data in any industry. Patients connect to providers, providers connect to referrers, claims connect to diagnoses, prescriptions connect to outcomes, and every care decision can influence cost, quality, and risk downstream. Yet most healthcare data still lives in systems that flatten those relationships into tables. That architectural mismatch is becoming one of the biggest obstacles to modern healthcare analytics and AI.
Claims warehouses, EHR exports, and FHIR repositories are strong at storing records and supporting scheduled reporting. But they struggle with the connected questions healthcare leaders increasingly need to answer: Which provider networks drive avoidable readmissions? Which claim patterns suggest coordinated fraud? Which patient journeys produce the best outcomes per dollar? Which referral relationships shape prescribing or device adoption?
A healthcare graph database models patients, providers, claims, diagnoses, prescriptions, procedures, devices, pharmacies, and referrals as a connected network. That structure makes relationship-heavy analytics operational, not just possible. The challenge is no longer collecting healthcare data. It is understanding how that data connects across patients, providers, organizations, and time.
You’ll learn:
- Why relational systems create analytical blind spots for fraud, cost, and referral intelligence
- What a healthcare graph database adds and how it differs structurally from relational systems
- Where graph outperforms flat analytics across four high-value use cases
- How graph and AI combine to power the next generation of healthcare decision support
What Is a Healthcare Graph Database?
A healthcare graph database stores clinical and administrative entities: patients, providers, claims, diagnoses, prescriptions, procedures, pharmacies, devices, and referrals. It stores them as a connected network rather than as rows in separate tables. Relationships between those entities are first-class data, making it possible to query across many connections in real time without relying on repeated joins. Healthcare graph databases are designed for relationship-heavy workloads: fraud detection, patient journey analysis, referral network mapping, cost-of-care analytics, and AI-grounded decision support.
Relational systems store healthcare data in one table per entity type: providers, claims, diagnoses, prescriptions. To answer a question that spans those entities, an analyst must join those tables repeatedly. At payer scale, the queries that matter most – which providers share patients with a known high-risk biller, and which of those patients also filled prescriptions at the same pharmacy cluster – require assembling answers from five or more tables simultaneously. Those joins become increasingly expensive as the number of entities, relationships, and traversal depth grows, and they only get slower as the dataset grows.
A healthcare graph database stores those connections explicitly and queries them directly. The relationships are already in the data model, so following a chain across providers, patients, claims, and pharmacies is fast regardless of network size. That structural difference is why healthcare organizations turn to graph when their analytics platforms hit a ceiling: not because relational systems are poorly built, but because they were built for record storage, not network-level intelligence.
Graph vs. Flat Analytics: Key Differences for Healthcare
| Graph Database | Relational / Claims Warehouse | |
| Data model | Entities and relationships stored as a connected network | One table per entity type; relationships recorded via foreign keys |
| Relationship queries | Follow connections directly; no joins required | Require repeated JOIN operations across tables |
| Multi-step network analysis | Native; performance holds as depth increases | Expensive; performance degrades with each additional join |
| Fraud ring detection | Identifies coordinated patterns across providers, patients, pharmacies, and billing entities | Detects individual anomalies; misses coordinated multi-party schemes |
| Patient journey analysis | Models the full care pathway as a connected sequence | Requires reassembling the journey from multiple disconnected tables |
| Referral network intelligence | Maps actual provider relationships and influence paths | Aggregates referral counts; cannot model network topology |
| Explainability | Traces decisions back to specific relationships | Can attribute outcomes to records but not to relationship chains |
| Best-fit workloads | Fraud detection, journey analysis, referral mapping, cost-of-care analytics, AI decision support | Reporting, claims processing, population-level aggregation, scheduled analytics |
The most significant difference is the class of question each system can answer. Relational systems handle aggregate questions well. Graph handles network questions: which providers are connected through shared patients and shared billing entities to a known high-risk cluster? Those are fundamentally different analytical tasks.
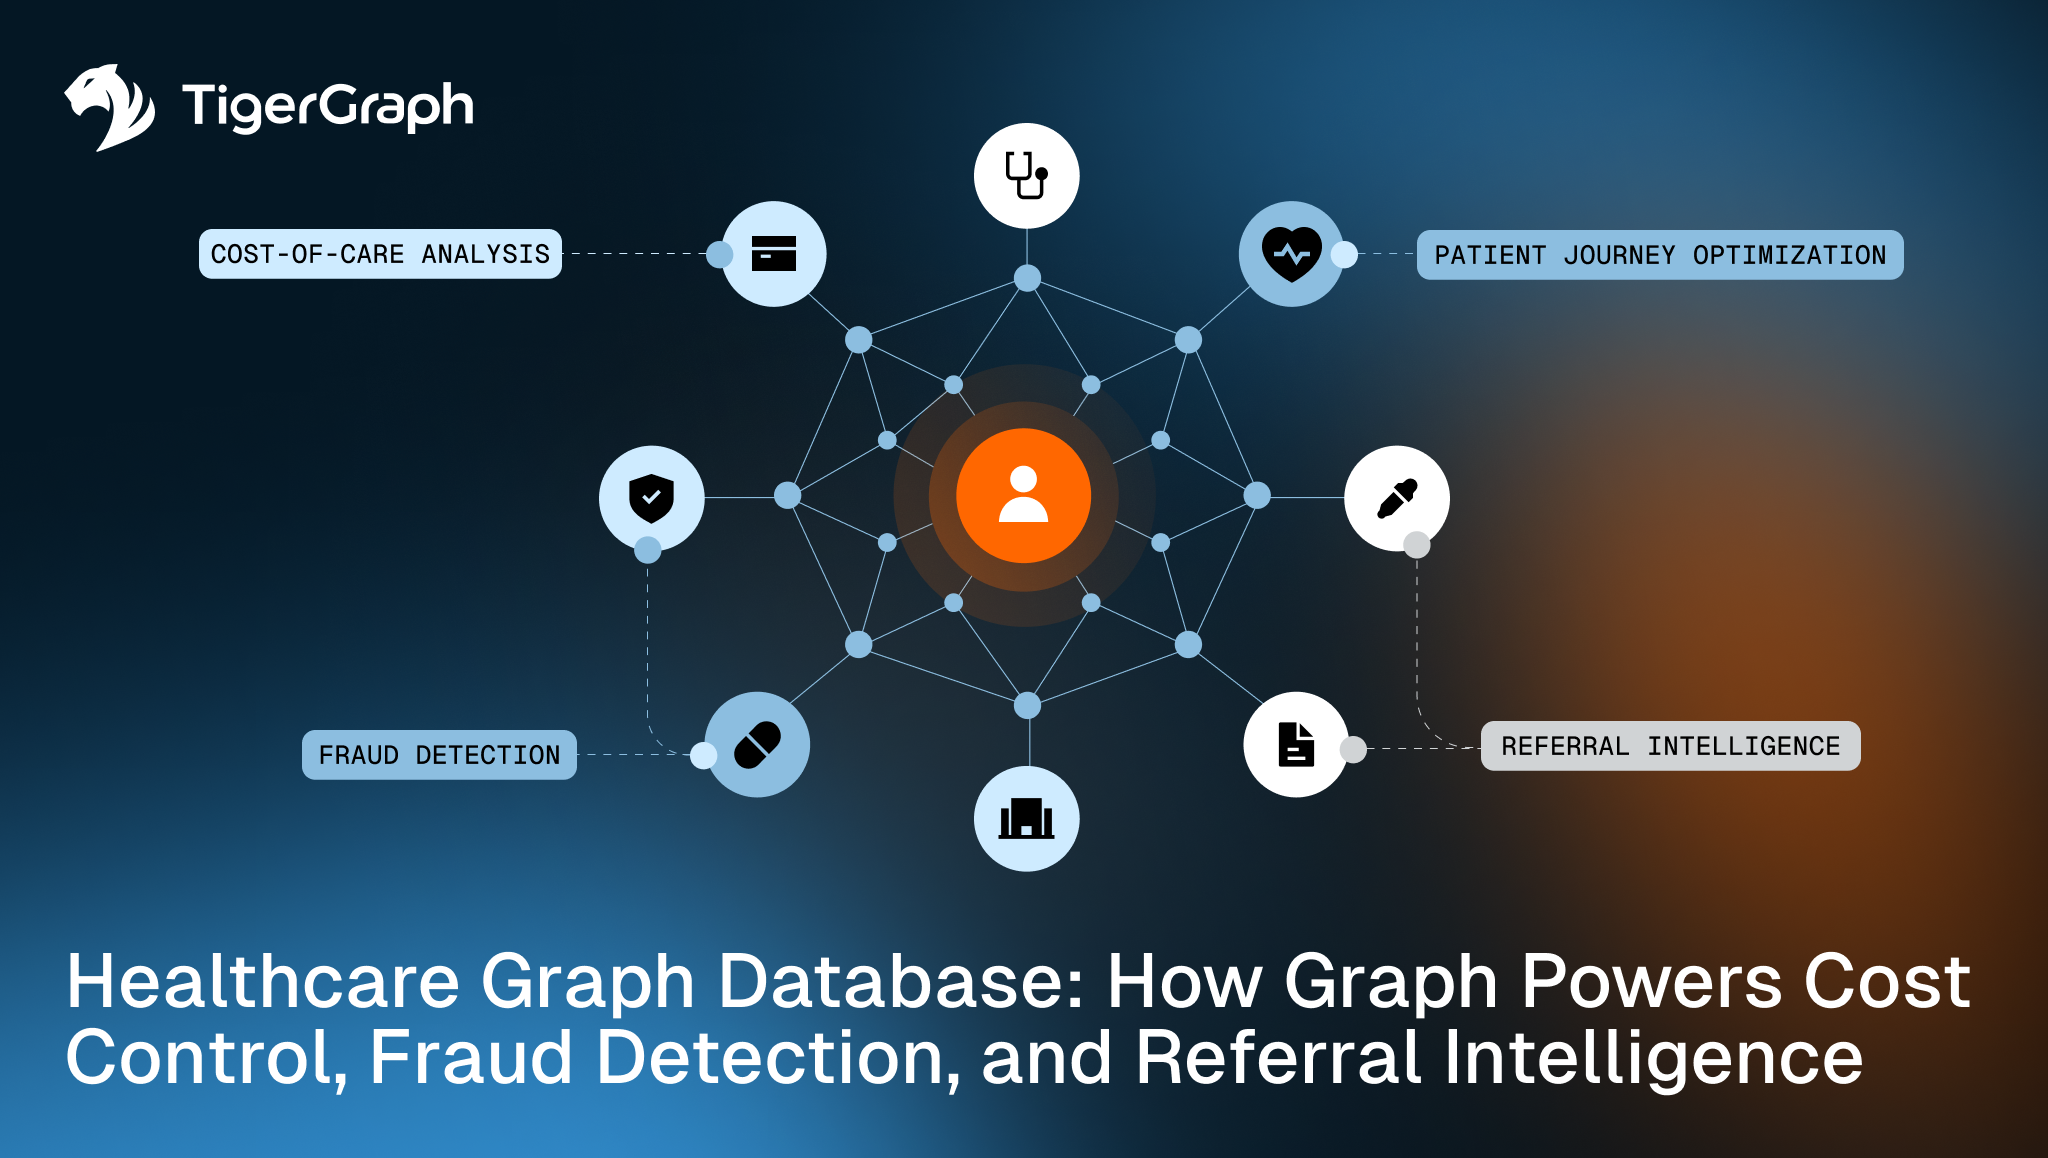
Four Healthcare Use Cases Where Graph Outperforms
Cost-of-Care Analysis
A flat claims report explains what happened. A healthcare graph database helps explain why it happened. A healthcare graph database shows why. It connects patients to diagnoses, treating providers, medication histories, referral sequences, procedures, adverse events, and downstream claims in a single query. This surfaces patterns – avoidable specialist routing, prescription cascades, follow-up gaps – that flat reporting attributes to individual claims rather than to the network behavior producing them.
The U.S. healthcare system has little room for these blind spots. According to CMS National Health Expenditure data, U.S. health spending reached $5.3 trillion in 2024, or $15,474 per person. At that scale, even small shifts in provider network behavior, specialist routing, or prescription patterns create material financial exposure. Graph gives payers the visibility to target cost-containment programs at the specific providers and pathways driving excess spend, rather than applying broad controls across the full population.
Healthcare Fraud, Waste, and Abuse Detection
Healthcare fraud rarely appears as a single bad claim. It appears as a relationship pattern: billing collusion between providers, opioid prescribing networks, durable-medical-equipment kickback rings, or synthetic-patient schemes assembled across multiple billing entities. These patterns are invisible when every claim is evaluated in isolation.
Graph connects entities that appear unrelated in flat data: shared addresses, shared patients, repeated referral loops, and clusters of claims flowing through common billing entities. The Department of Justice’s 2025 healthcare fraud takedown, involving charges connected to more than $14.6 billion in alleged fraud, reflects exactly the kind of coordinated network behavior that graph is built to detect. For payers, that means shifting from reactive “pay and chase” investigation to earlier, pattern-based prevention.
Patient Journey Optimization
A patient moves across symptoms, diagnoses, providers, prescriptions, procedures, labs, claims, complications, and outcomes. A healthcare graph database models that journey as a connected path rather than a sequence of disconnected records. Payers and integrated providers can compare care pathways across similar patient populations, identify where high-risk patients fall out of follow-up, and find the routes that produce better outcomes at lower cost. Graph can reveal that two patients with similar diagnoses follow very different system routes: one to stable outcomes, one to repeated utilization and higher cost – a distinction flat reporting obscures.
This matters most in value-based care environments where reimbursement depends on demonstrating that care coordination is working. Graph gives care teams the operational visibility to identify high-risk patients before they deteriorate, close care gaps before they become readmissions, and prioritize interventions on the pathways where network behavior is driving avoidable cost.
Referral Network Intelligence
Referral networks shape care access, specialist utilization, prescribing behavior, and commercial influence. Graph shows which physicians refer within the network, which specialists create bottlenecks, where leakage occurs, and how referral behavior shifts over time. For pharmaceutical and medical-device teams, graph maps key opinion leaders, specialist hubs, and the influence networks that drive adoption decisions. The result is a shift from territory-based planning to network-based engagement: prioritizing providers whose relationships shape the broader system, not just those with the highest historical volume.
Graph + AI: How the Combination Powers Healthcare Analytics
Graph and AI are deeply complementary in healthcare. Graph provides the connected context that healthcare models need to reason accurately. AI provides the pattern recognition that turns relationship data into actionable clinical, operational, and commercial signals.
Graph enables richer features for risk and cost models: relationship-aware signals such as provider-network centrality, referral concentration, prescribing-cascade depth, and distance from known high-risk patterns improve models for readmission risk, cost prediction, and care-management prioritization. Graph machine learning extends this further – learning from the structure of provider-claim-patient relationships to identify emerging fraud configurations before a rule has been written.
GraphRAG addresses a different gap: healthcare AI assistants need grounded context, not just semantic similarity. A clinical AI assistant working from vector search alone can surface plausible answers drawn from similar-sounding documents. A healthcare graph database changes what retrieval means: instead of finding similar text, the system follows the actual relationships connecting the patient’s conditions, providers, medications, prior authorizations, and care history. GraphRAG connects that structured network to the retrieval process, improving traceability and reducing the risk of answers that sound reasonable but lack grounding in the patient’s actual record.
Across all of these applications, graph adds explainability: every AI-assisted recommendation can be traced back to the specific relationships that informed it. In healthcare, that is not optional – clinicians, compliance teams, and fraud investigators all need to understand why a decision was made, not just what it was.
Enterprise Use Cases: Where Healthcare Graph Applies
Graph applies across every segment of the healthcare ecosystem. Payers and health plans use it to detect claims fraud, model provider networks, and ground prior authorization AI in a patient’s full clinical and claims context. Integrated providers and health systems use it to map patient journeys, identify referral leakage, and find the care gaps that drive avoidable readmissions. Pharmaceutical and medical-device commercial teams use it to prioritize field-force engagement based on actual physician influence networks rather than territory. Government healthcare programs use it to surface fraud rings and opioid prescribing networks that span multiple billing entities.
For organizations working on identity and patient matching, graph complements entity resolution by linking fragmented records that refer to the same patient, provider, or billing entity. For organizations building richer member and patient views, it supports Customer 360 approaches adapted to healthcare contexts. Healthcare data modernization teams using FHIR will find that FHIR enables record exchange but does not solve relationship analytics – graph adds the intelligence layer on top.
Why Healthcare Analytics Needs an Enterprise Graph
Healthcare has always been a network. The technology used to analyze it is finally catching up. The questions that drive cost control, fraud detection, care quality, and referral strategy all depend on understanding how patients, providers, claims, prescriptions, and outcomes connect to one another. Relational systems answer those questions poorly at scale. A healthcare graph database answers them directly, in real time, with the explainability that clinical oversight and compliance require.
As the industry moves toward value-based care, predictive risk management, and AI-grounded operations, the analytical advantage will go to organizations that treat their data as a network. TigerGraph provides the enterprise-grade healthcare graph database platform to make that possible: supporting fraud detection, cost-of-care analytics, patient journey optimization, referral intelligence, and AI-grounded decision support across the full healthcare ecosystem.
Ready to see what graph can do for your organization? Explore TigerGraph Healthcare and Life Sciences or request a demo to talk through your use case.
FAQ: Healthcare Graph Database
What is a healthcare graph database?
A healthcare graph database stores providers, patients, claims, prescriptions, referrals, diagnoses, procedures, and outcomes as a connected network. It enables the relationship-heavy queries that drive cost, fraud, journey, and referral analytics: queries that require following connections across many entities simultaneously, which relational systems handle poorly at scale.
How does a graph database improve healthcare analytics?
A graph database improves healthcare analytics by making relationships directly analyzable at scale. It surfaces referral patterns, fraud rings, patient journey paths, and cost drivers that flat claims warehouses struggle to identify in real time. The key difference is structural: graph stores connections as data, so queries spanning many entities do not require assembling the answer from multiple tables.
What are the use cases for graph databases in healthcare?
Common healthcare graph database use cases include cost-of-care analysis, fraud waste and abuse detection, patient journey optimization, referral network intelligence, clinical research, real-world evidence, and AI-grounded decision support. Each requires analyzing relationships across multiple entity types simultaneously, which is the structural task graph databases are built for.
How is graph used in healthcare fraud detection?
Graph is used in healthcare fraud detection by connecting providers, patients, claims, prescriptions, pharmacies, addresses, referrals, and billing entities in a single queryable network. This helps detect organized patterns such as billing collusion, opioid networks, kickback rings, and synthetic-patient schemes: patterns that appear unrelated in flat data but become visible when the connections are mapped.
What is the best graph database for healthcare?
The best healthcare graph database depends on scale, security, AI integration, and workload requirements. For enterprise healthcare workloads requiring real-time, multi-step relationship analytics across claims, providers, patients, and AI use cases, TigerGraph is purpose-built for those requirements, combining enterprise-scale graph analytics with AI-ready infrastructure and built-in support for explainable decision intelligence.