Introduction
Hello everyone! I’m Xuanlei Lin. I have worked as a solution engineer at TigerGraph for two years and as a customer success consultant for another two years. Throughout this period, I have been involved in over 60 projects utilizing TigerGraph. In this blog, I would like to introduce you to a powerful feature of TigerGraph called multi-edge. Multi-edge refers to a concept in graph theory where multiple edges, or connections, exist between two nodes in a graph. In a traditional graph, each pair of nodes can have at most one edge connecting them. However, in a multi-edge graph, two nodes can be connected by multiple edges, indicating different types of relationships or interactions between them. Multi-edge graphs are often used to model complex systems where multiple interactions or relationships exist between entities.
Recently, I had the opportunity to leverage the multi-edge functionality to assist an insurance customer in implementing temporal search for agent hierarchy. While this project was specific to the insurance industry, multi-edge is a solution for temporal search for many other industries and use cases.

In this blog post, I will present a simplified version of the demo based on the project I recently completed. Firstly, I will outline the business requirements and the technical challenges associated with their implementation. Next, I will introduce a solution that leverages TigerGraph’s multi-edge functionality. Additionally, I will explore further use cases of multi-edge in the insurance industry and other sectors.
Requirements
Before we begin, let me provide some background information on the business domain. In the insurance industry, particularly in life insurance companies, agents, also referred to as salespersons, play a crucial role as the primary sales channel for insurance policies. A large insurance company may have many thousands of agents organized into multi-level groups. The hierarchical structure consists of groups at the lowest level, departments in the middle, and regions at the highest level. Each group/department/region is overseen by a manager, and every agent belongs to one specific group/department/region.
Apart from the hierarchical relationships, there are two additional types of relationships between agents. The first is the introduction relationship, where any agent can recommend new agents to the company. The second is the fostering relationship, which occurs when an agent is promoted to a higher managerial position within a group/department/region. In this case, the agent’s former direct leader establishes a fostering relationship with the agent. The fostering relationship can be further categorized into three types based on the level of the new rank attained by the fostered agent: group, department, and region.
Let’s consider the leftmost group in Figure 1 as an example. Agents D, F, H, and K form a group, with D serving as the group manager. D is the manager of F, H, and K. D introduced F and H, and H introduced K. Agent B has a group fostering relationship with D.
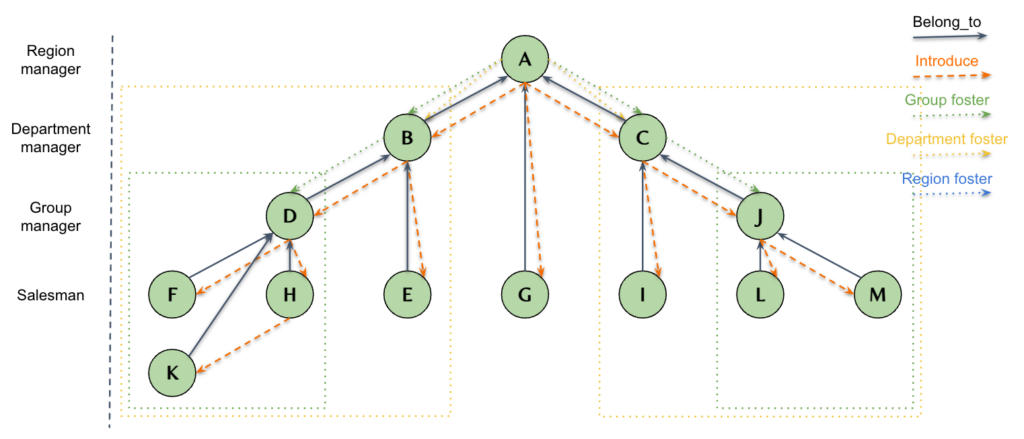
Figure 1
The hierarchy, introduction, and fostering relationships play a vital role in the performance appraisal of agents. The commission structure for agents consists of both direct and indirect commissions. The direct commission refers to the commission earned from the insurance policies sold by the agent personally. On the other hand, the indirect commission refers to the commission earned from the policies sold by other agents.
To illustrate, let’s consider an example: Agent A sells an insurance policy and receives a direct commission for the sale. However, not only does Agent A receive a commission, but A’s manager, introducer, and the agent who fostered Also receive a portion of the commission. This means that when Agent A sells a policy, their manager, the agent who introduced them, and the agent who fostered A all receive a share of the commission.
Challenges
As mentioned earlier, there are various relationships between agents, and the complexity arises from the fact that these relationships are subject to change over time. The company promotes or demotes agents on a monthly basis, based on their performance. Additionally, new agents join the organization while old agents may leave. Essentially, this creates a temporal graph where relationships evolve over time.
Traditional technologies like relational databases or big data solutions often struggle to effectively manage and maintain these dynamic relationships. Prior to joining TigerGraph, I was involved in a similar project where extensive SQL and Java code were required to implement the functionality. Unfortunately, the resulting codebase became incredibly complex, making it difficult for anyone to fully comprehend and maintain.
Solution
The challenges posed by this project may indeed be daunting for traditional technologies, but they are well within the capabilities of TigerGraph. Firstly, the scale of millions of agents is not a significant concern for TigerGraph, as it can support billions or even trillions of vertices. Secondly, TigerGraph excels in handling complex relationships and can effectively represent intricate connections.
The only difficulty lies in managing temporal relationships. Customers require the ability to view the latest agent hierarchy while also being able to trace the agent hierarchy back to a specific point in time. In earlier versions of TigerGraph, multi-edge support was lacking. As a workaround, an additional vertex type was introduced to record historical data between vertices. However, this workaround is no longer necessary due to the introduction of multi-edge, a more elegant and high-performance solution. Multi-edge allows for the existence of multiple edges of the same type between a pair of vertices. To differentiate between different edges between a pair of vertices, a Discriminator has been added, which can be understood as a primary key on the edge. For example, the following code is used to create edges representing the management relationship.

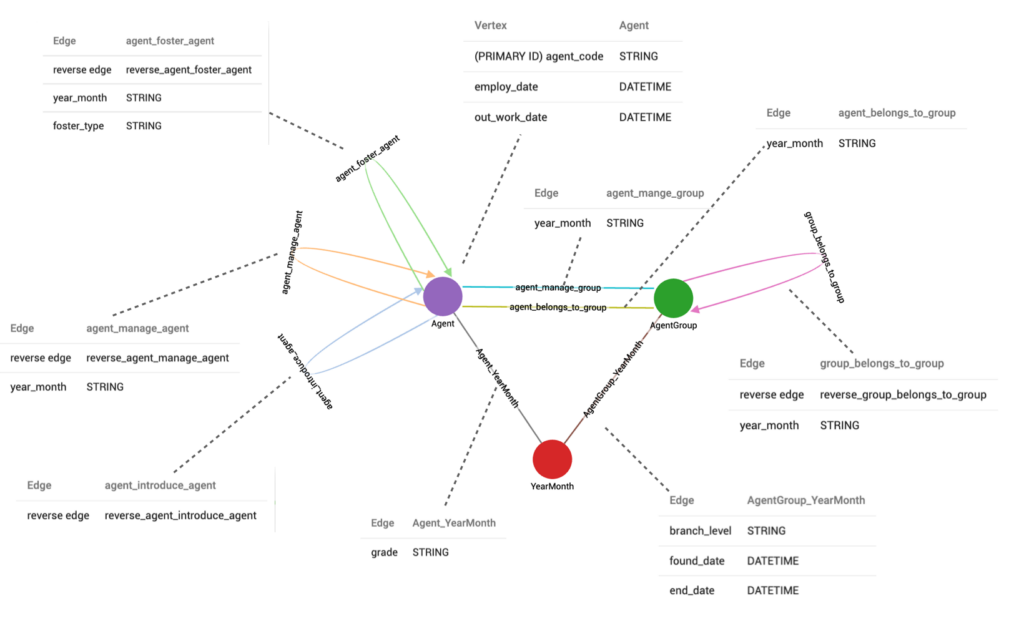
The schema design consists of a single vertex type, “Agent,” and an edge type, “agent_manage_agent,” which incorporates the “year_month” Discriminator to differentiate the management relationships for each month.
Below is the complete schema design:
After designing the schema and loading the data, we can create a query to perform the temporal search. This query will enable us to search for the hierarchy of agents at a specific moment in history. For example, if we input the date “2008-01-01,” the resulting agent hierarchy at that particular time would be as follows:
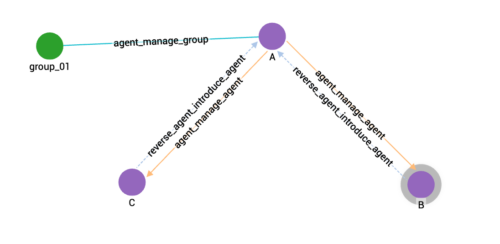
Figure 2
Next, if we input the date “2014-01-01,” we will obtain the following results:
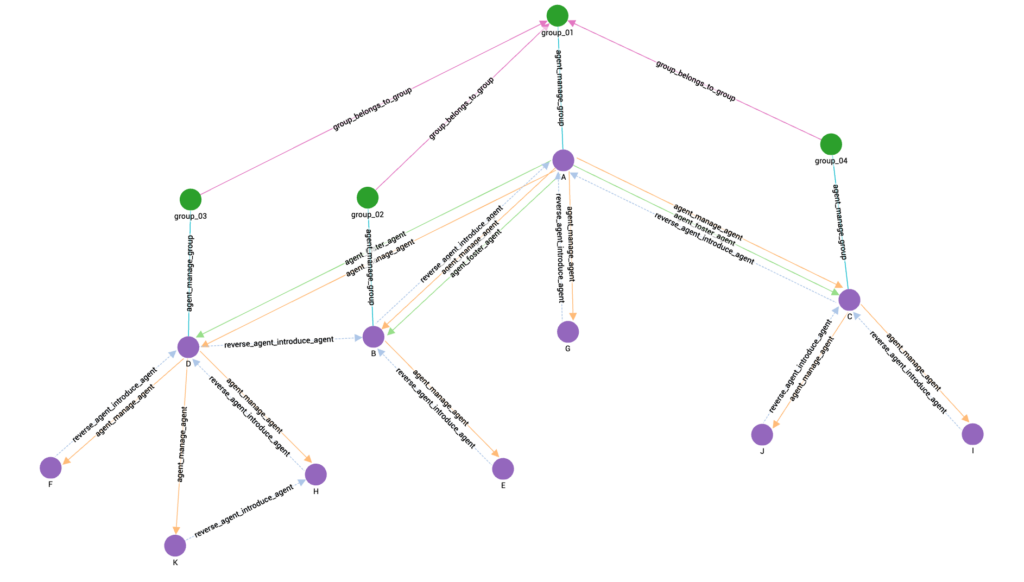
Figure 3
Lastly, if we input the date “2019-01-01,” we will obtain the following results:
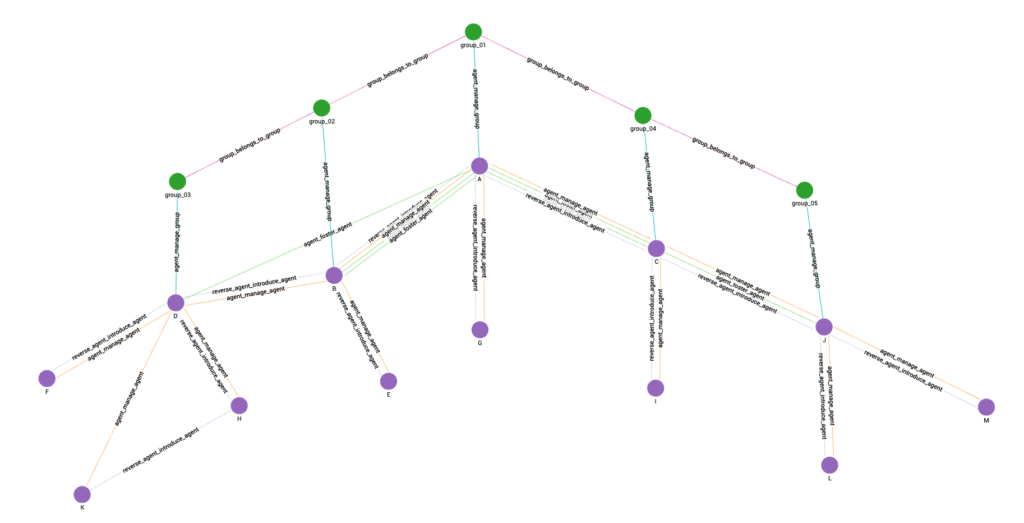
Figure 4
It should be noted that the agent hierarchy depicted in Figure 4 is the same as the one shown in Figure 1.
Further applications
As mentioned earlier, the above demo is just a simplified version. In actual projects, after establishing the temporal graph for the agent hierarchy, we can also associate more entities such as policies, applicants, insured individuals, claims, and commissions.
Once a more complete schema is established, we can have more diverse applications. For example:
- Based on the latest agent hierarchy, precalculate the performance of all agents for the upcoming months, end of quarters, and year-end, and make adjustments to the agent hierarchy based on performance precalculation.
- Look back at the historical agent hierarchy, and perform data analysis based on the agent hierarchy at that time.
- Combine with machine learning, extract features, and conduct retrospective testing.
The application of multi-edge in other industries
Multi-edge is a versatile technology that can be applied in various industries. In the telecommunications industry, there can be multiple connections between phones. In the banking industry, there can be multiple transactions between accounts. In the manufacturing industry, each component can have multiple parameters, and each parameter may have been measured at different times. All of these can be addressed using multi-edge.
Many more examples can be given, and you can apply the concept of multi-edge based on the characteristics of your industry’s data. I believe that using multi-edge can help you store data more effectively, write queries more conveniently, and retrieve information faster.
If you’re interested in exploring how TigerGraph can open up new dimensions with your data, you can sign up for a free instance of TigerGraph Cloud at
tgcloud.io or contact us at
[email protected].

 In this blog post, I will present a simplified version of the demo based on the project I recently completed. Firstly, I will outline the business requirements and the technical challenges associated with their implementation. Next, I will introduce a solution that leverages TigerGraph’s multi-edge functionality. Additionally, I will explore further use cases of multi-edge in the insurance industry and other sectors.
 Figure 1
The hierarchy, introduction, and fostering relationships play a vital role in the performance appraisal of agents. The commission structure for agents consists of both direct and indirect commissions. The direct commission refers to the commission earned from the insurance policies sold by the agent personally. On the other hand, the indirect commission refers to the commission earned from the policies sold by other agents.
To illustrate, let’s consider an example: Agent A sells an insurance policy and receives a direct commission for the sale. However, not only does Agent A receive a commission, but A’s manager, introducer, and the agent who fostered Also receive a portion of the commission. This means that when Agent A sells a policy, their manager, the agent who introduced them, and the agent who fostered A all receive a share of the commission.
 The schema design consists of a single vertex type, “Agent,” and an edge type, “agent_manage_agent,” which incorporates the “year_month” Discriminator to differentiate the management relationships for each month.
Below is the complete schema design:
 After designing the schema and loading the data, we can create a query to perform the temporal search. This query will enable us to search for the hierarchy of agents at a specific moment in history. For example, if we input the date “2008-01-01,” the resulting agent hierarchy at that particular time would be as follows:
 Figure 2
Next, if we input the date “2014-01-01,” we will obtain the following results:
 Figure 3
Lastly, if we input the date “2019-01-01,” we will obtain the following results:
 Figure 4
It should be noted that the agent hierarchy depicted in Figure 4 is the same as the one shown in Figure 1.

