
Manage Energy Network Performance With TigerGraph
Growth in primary energy consumption for 2017
People affected by power outage in 2017
Losses due to power outages in 8 key US markets
The Demands on Energy Networks Are Increasing
The world’s energy needs are growing at a steady pace. The global energy consumption increased by 2.2% in 2017, the fastest growth since 2013. The economic impact of a power outage is massive, with eight key U.S. market segments studied by energy consultant E Source losing about $27 billion per year due to power outages. Now, more than ever, all power grid operators need faster energy management systems to balance and even out the spikes in demand or drops in supply to minimize the impact of outages.
Read More
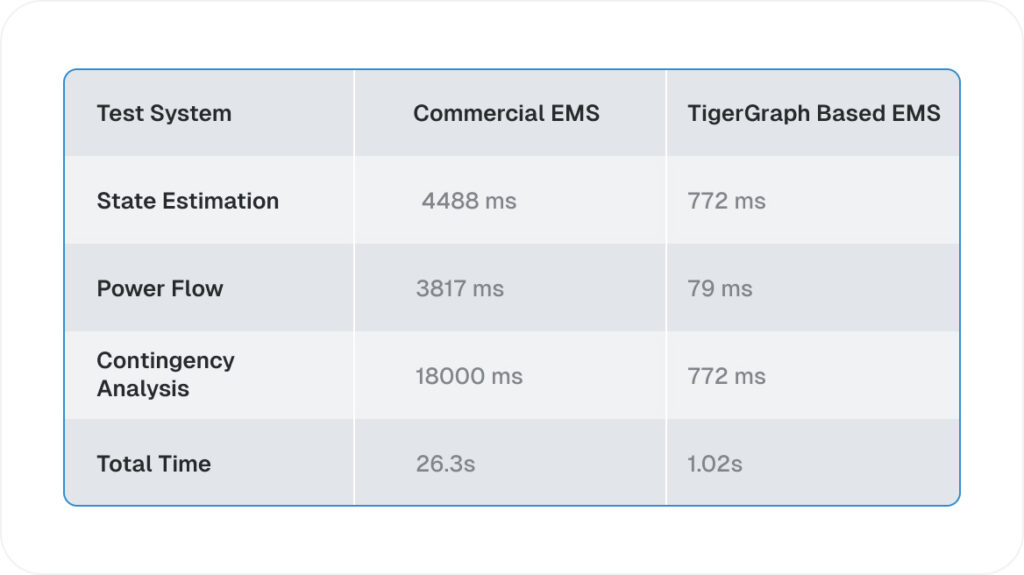
Legacy Systems Are Insufficient at Balancing Supply and Demand

Database for Energy Management System?
Monitor Internet of Things Data Using Graph Analytics
From meter readings to information from network sensors, utility companies are being flooded with data – a typical network can contain as many as 10 billion devices, each one providing minute-by-minute updates.
Balancing a power grid requires consolidating signals from multiple levels of the power infrastructure and matching demand and supply with complex linear equations, which is deep link analytics taken to the extreme. Using TigerGraph to process all of their power grid data, network operators can respond immediately to sudden spikes in demand or drops in supply, thus reducing operational risk and operating costs while improving reliability, efficiency, and customer experience.
Read More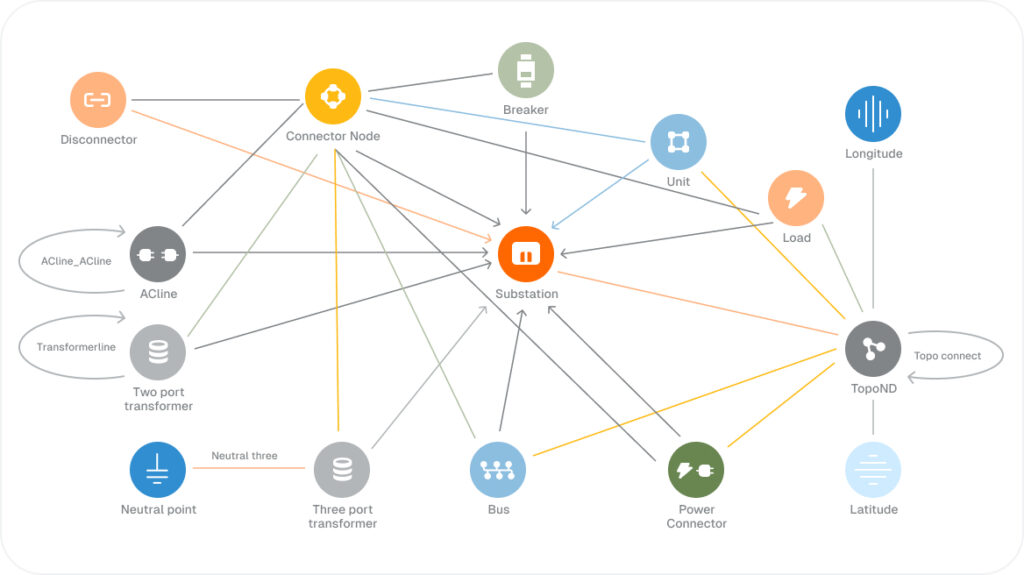
Balance Supply and Demand Using Graph Analytics