Geospatial Analytics with Graph Database
Obtain Insights From Geospatial Data With TigerGraph


Geospatial Analysis Is Becoming a Must-Have for Many Organizations
The popularity of cloud computing. the proliferation of big data and the increasing footprint of the Internet of Things is mandating faster and more intuitive integration with geospatial analytics. The geospatial analytics market reached 38.65 billion in 2017 and is estimated to grow at an annual rate of 18.2% through 2027.
It’s no surprise, therefore, that over 78% of C-level executives are planning to invest in location data next year since the location data is used for finding new markets and revenue sources, delivering timely and tailored marketing campaigns and detecting fraudulent activities in real-time. For many enterprises it has been a real challenge to provide a unified solution to both online transaction processing and online analytical processing workloads simultaneously to satisfy their core business requirements, and adding real-time geospatial capability with seamless integration to existing and future applications, with the minimal redesign of data schema and models.
Legacy Systems Are Insufficient for Geospatial Analysis
Relational databases are poorly suited to geospatial analytics for several reasons: first of all, the data model is not designed for complex location-based analytics questions in real time; secondly, the geospatial analytics may rely on third-party index; and, in addition, there are no easy SQL queries to answer these complex location focused questions. Traditional geospatial analytics applications built on relational databases were not designed to address this challenge. Due to these challenges, many organizations have taken geospatial analytics into their core business intelligence modeling and are missing crucial insights as a result.
Why TigerGraph, a Native Parallel Graph Database for Geospatial Analysis?

Uncover Insights From Geospatial Data Using Deep Link Analytics
Graph databases provide the capabilities that organizations need for geospatial analytics because they model the surrounding environment as interconnected entities and explore the relationship between people and things. Geolocation data is an intuitive addition to graph data modeling, which is naturally designed to model the absolute and relative position of the entities.
TigerGraph empowers organizations to expand their solutions, adding the location dimension(s) to the use cases. TigerGraph’s geospatial analytics can easily traverse 10 or more steps to deliver new insights based on the location data.
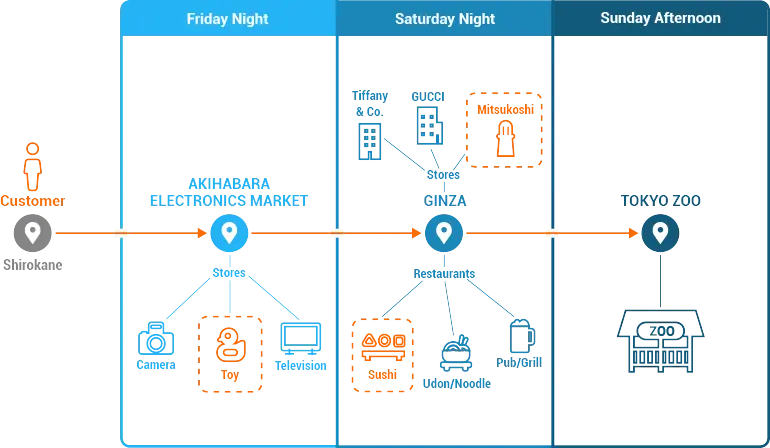
Consider a mobile offer or recommendation system that factors in the customer movement data, where customers are categorized into different mobility patterns based on their movement during weekdays and weekends. Popular commercial locations such as stores or restaurants are also considered.
TigerGraph combines the transactional data from sales and service channels containing browsing, search and purchase history, with the location history data indicating the most popular commercial locations such as stores and restaurants for the customer. All of this information is combined with the real-time location of the customer and a tailored mobile offer (such as 30% off at a store in downtown San Francisco or Tokyo) is computed for real-time delivery to opt-in customers.
In order to detect these hidden relationships among location, time, product, transaction and customer data, TigerGraph executes a deep link query with 6+ hops going across multiple connected entities to find the location-based product or store recommendation.
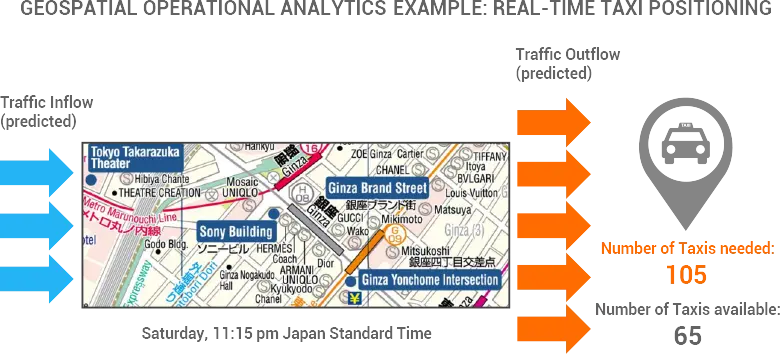
Get Insights From Geospatial Data Using Real-Time Analytics
Imagine a ride-hailing company which tries to identify vehicle supply and demand mismatch, to predict and resolve long passenger wait time and reduce vehicle idling time in a busy metropolitan area. Real-time geo insights from TIgerGraph can identify these issues and recommend actions to resolve them. A large amount of geospatial data is collected continuously. TigerGraph can analyze and detect the movement patterns of many people and vehicles at the same time and respond in real-time to the demands from millions of customers moving across a dense Metropolitan area such as New York, London, and Tokyo.

Uncover Insights From Geospatial Analysis of Internet of Things Data
Geospatial analytics is particularly relevant for the Internet of Things as all the resources (sensors, switches, routers) in the network are connected and there is a location tag associated with the collected information. TigerGraph enables you to process signals coming in from all of your sensors, actuators, switches and routers, map those based on their locations and perform complex calculations in real-time to make decisions.