TigerGraph Unveils Next Generation Hybrid Search to Power AI at Scale; Also Introduces a Game-Changing Community Edition
Read Press Release
Contact Us
A smooth gradient background transitioning from light blue at the bottom left corner to white at the top right, creating a soft and airy appearance.

TigerGraph Insights

A powerful graph visualization and analytics tool to unlock deeper and smarter insights from TigerGraph with no coding required.

Search, Explore, Compose, and Get Insights

The software interface features a graph visualization configuration screen. On the right panel, options allow you to customize the graph, including sections for widget type, parameters, and refresh settings. A notification about the data source is conveniently located at the bottom.
Feature 1

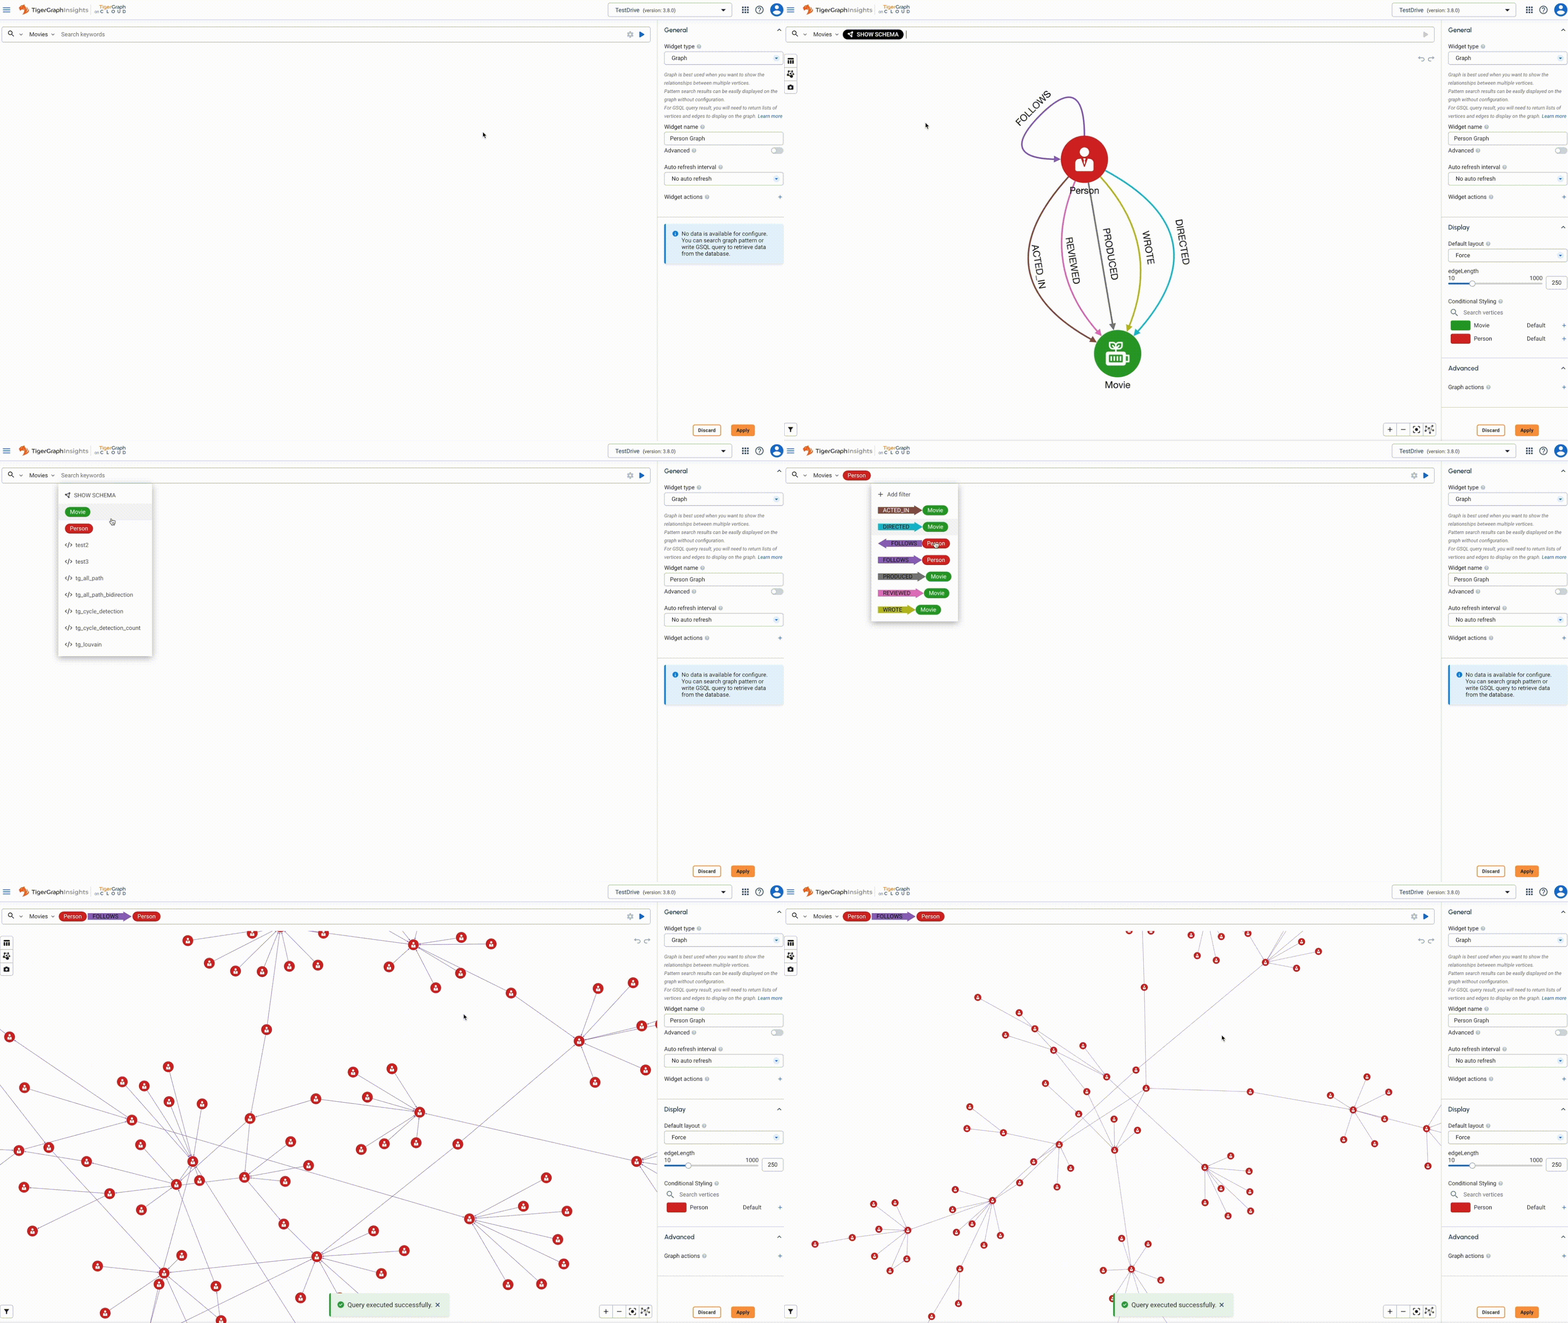
Search

With TigerGraph Insights, deep dive into the large graph and gain deeper insight by specifying intuitive graph patterns that represent your business questions. Schema-derived auto-completion and recommendation jump-start your graph journey in minutes.
Graph visualization with red nodes connected by lines in a radial layout, displayed on a software interface. The nodes form clusters and branches spreading out from several central points. The interface features a menu on the left and a circular add button at the bottom right.
Feature 2

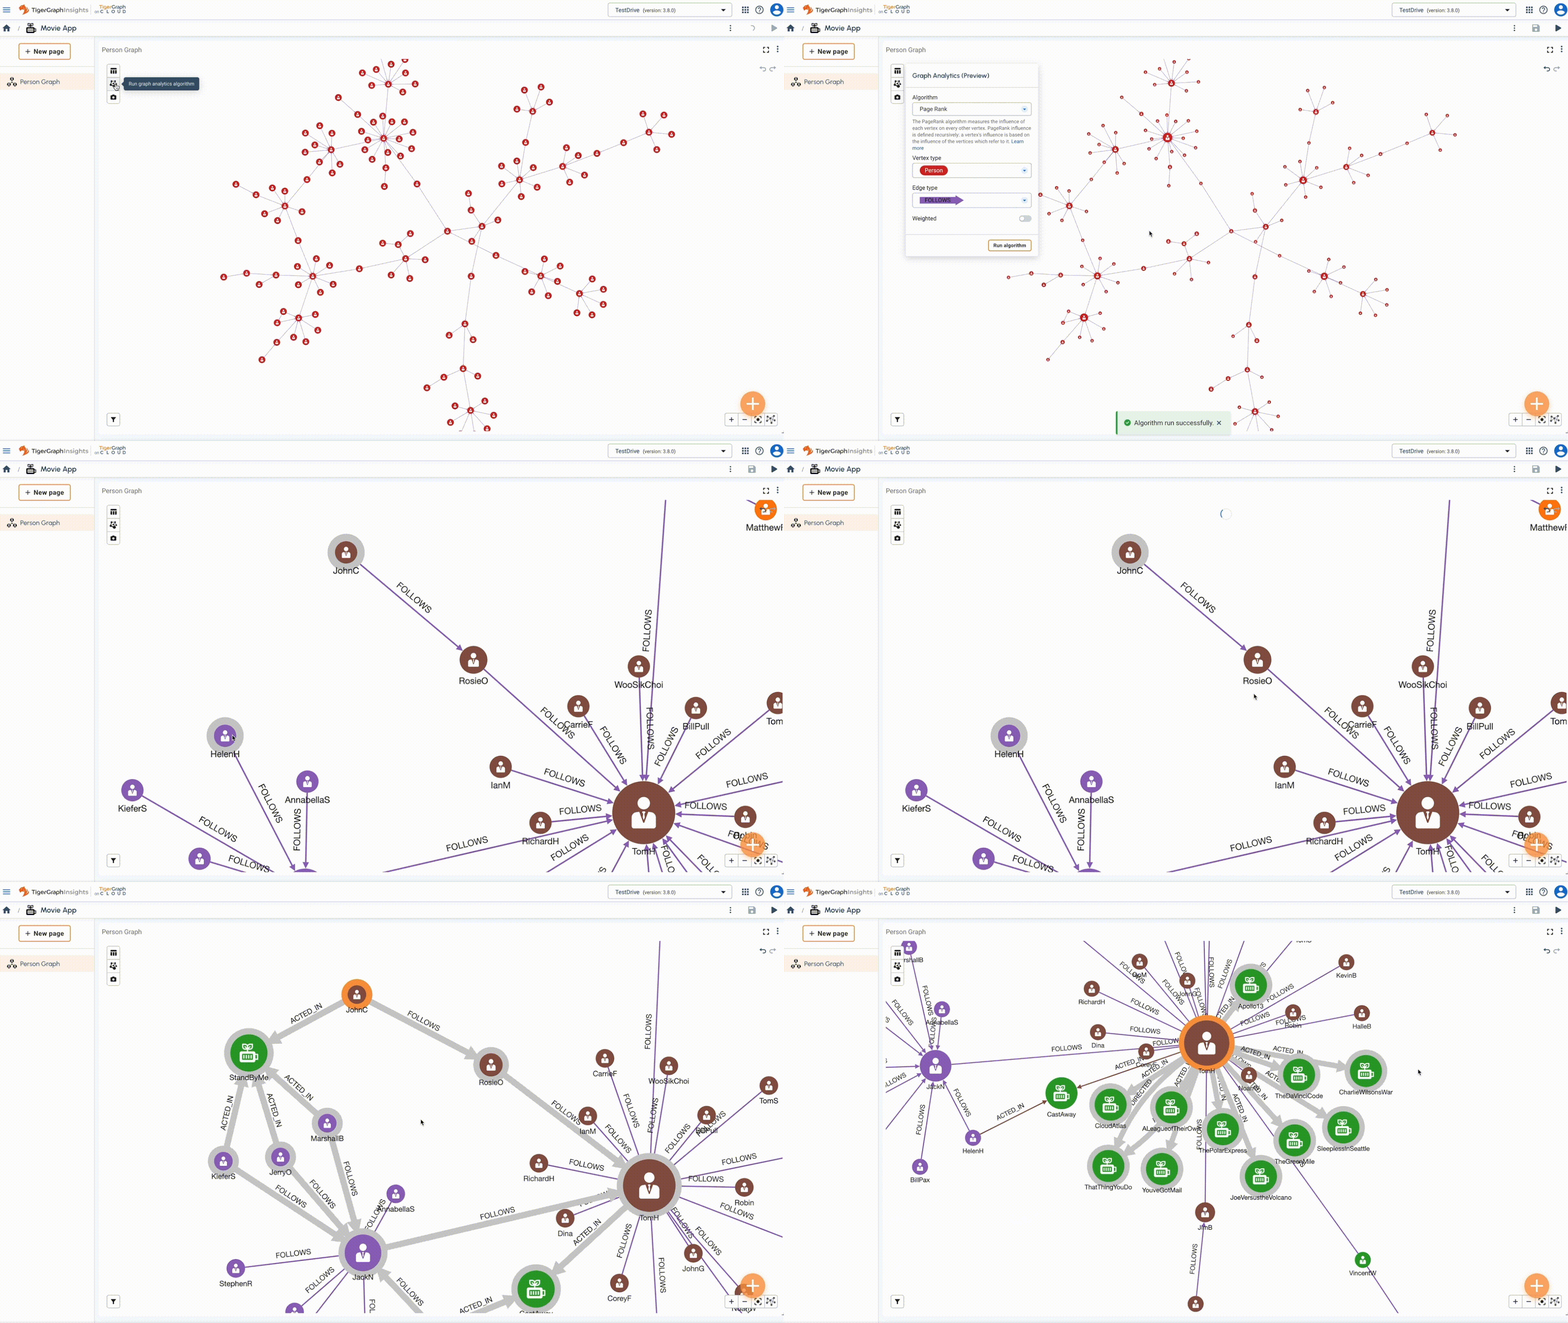
Explore

With TigerGraph Insights, investigate and explore data that drives meaningful outcomes by interactive graph analytics including graph neighborhood exploration, pathfinding, graph data science algorithms, and so on.
Screenshot of a cloud-based graph querying interface with vivid graph visualization. The query selects the average rating of Movie1 from a graph database named Movies1. Instructions and a warning about graph data availability are visible.
Feature 3

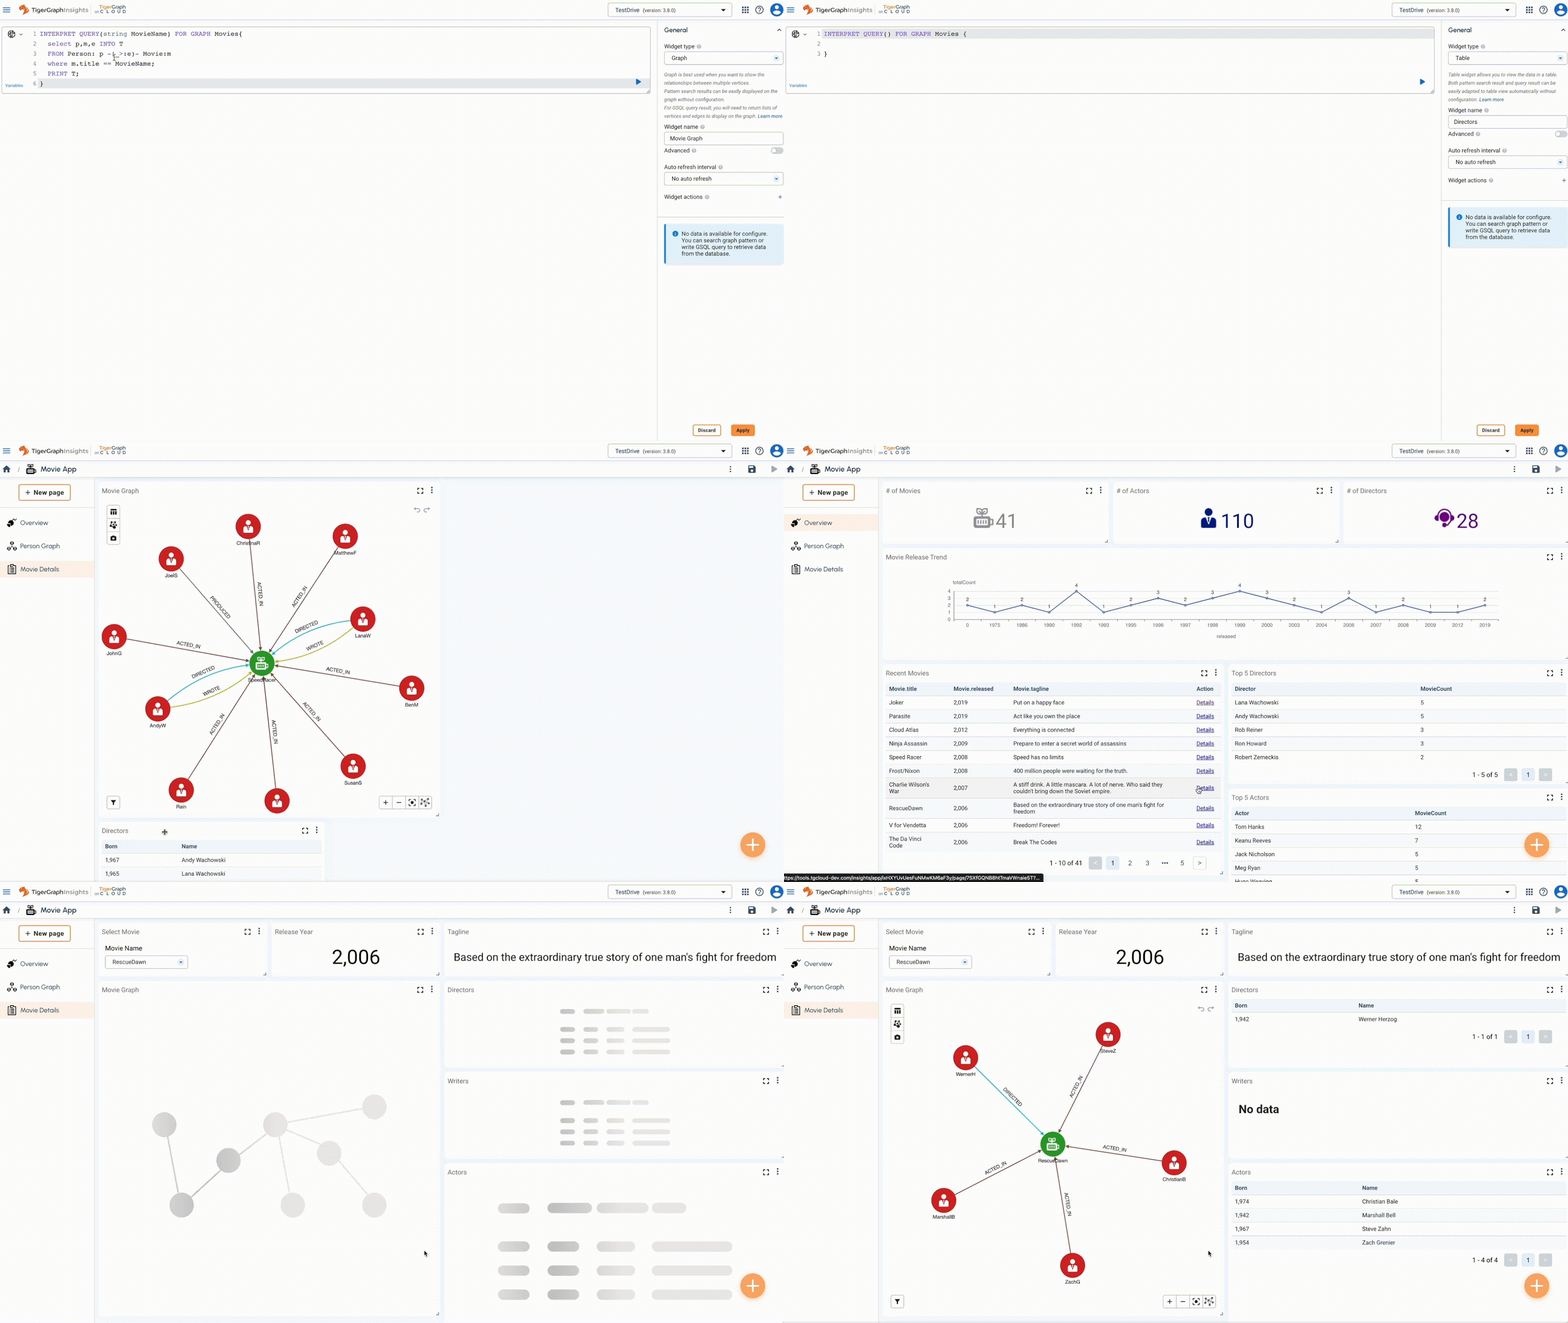
Compose

With TigerGraph Insights, you are equipped with compelling visual graph storytelling capabilities to showcase underlying graph data and insights in a variety of visual representations, including network graphs, tables, charts and more. These multidimensional and interactive visual views can be linked together into a cohesive multi-page interactive dashboard application.
A minimalistic background with a light blue gradient and faint dotted lines forming angular patterns, connecting small blue dots at some intersections. The overall design has a subtle, abstract geometric feel.
A light blue, minimalistic background with faint outlines of squares and a single small blue dot on the lower left. The design creates a sense of calm and simplicity.

Get Started with TigerGraph Insights

Ready to start unlocking deeper and smarter insights from TigerGraph? Try Insights for free on
TigerGraph Cloud now!

Start Free